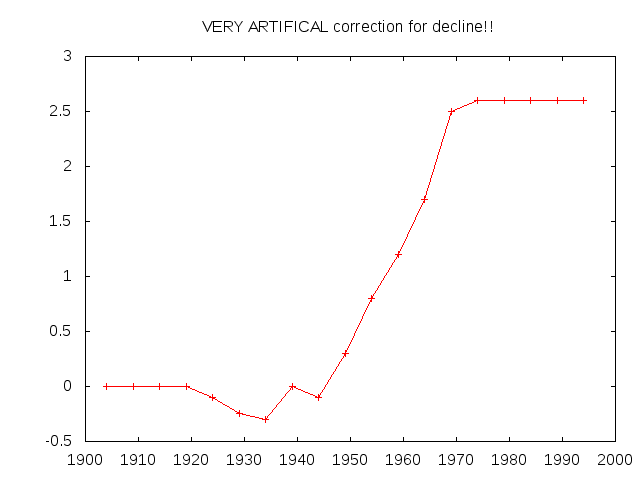
From the CRU code file osborn-tree6/briffa_sep98_d.pro , used to prepare a graph purported to be of Northern Hemisphere temperatures and reconstructions.
;
; Apply a VERY ARTIFICAL correction for decline!!
;
yrloc=[1400,findgen(19)*5.+1904]
valadj=[0.,0.,0.,0.,0.,-0.1,-0.25,-0.3,0.,- 0.1,0.3,0.8,1.2,1.7,2.5,2.6,2.6,$
2.6,2.6,2.6]*0.75 ; fudge factor
if n_elements(yrloc) ne n_elements(valadj) then message,’Oooops!’
;
yearlyadj=interpol(valadj,yrloc,timey)
This, people, is blatant data-cooking, with no pretense otherwise. It flattens a period of warm temperatures in the 1940s 1930s — see those negative coefficients? Then, later on, it applies a positive multiplier so you get a nice dramatic hockey stick at the end of the century.
All you apologists weakly protesting that this is research business as usual and there are plausible explanations for everything in the emails? Sackcloth and ashes time for you. This isn’t just a smoking gun, it’s a siege cannon with the barrel still hot.
UPDATE2: Now the data is 0.75 scaled. I think I interpreted the yrloc entry incorrectly last time, introducing an off-by-one. The 1400 point (same as the 1904) is omitted as it confuses gnuplot. These are details; the basic hockey-stick shape is unaltered.
UPDATE3: Graphic is tenmporily unavailable due to a server glitch. I’m contacting the site admins about this.